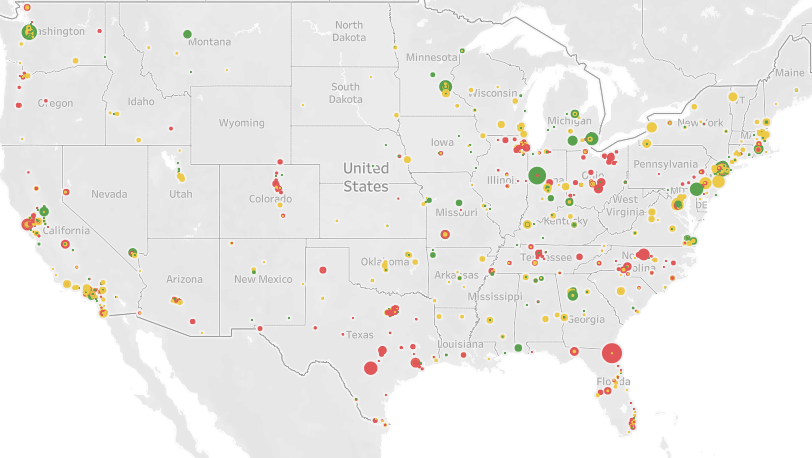
Visualisation of Survey Results

A dashboard to illustrate results of a survey of Data Professionals conducted by Alex Freberg. 630 data professionls were sample but by no means in a rigorous fashion. The data was cleaned in R and visualisation were crafted in Tableau.